AFBR-5803ATZ データシートの表示(PDF) - Avago Technologies
部品番号
コンポーネント説明
メーカー
AFBR-5803ATZ
Avago Technologies

AFBR-5803ATZ Datasheet PDF : 16 Pages
| |||
Application Information
The Applications Engineering group in the Avago
Technologies Fiber Optics Communication Division is
available to assist you with the technical understanding
and design trade-offs associated with these transceivers.
You can contact them through your Avago Technologies
sales representative.
The following information is provided to answer some
of the most common questions about the use of these
parts.
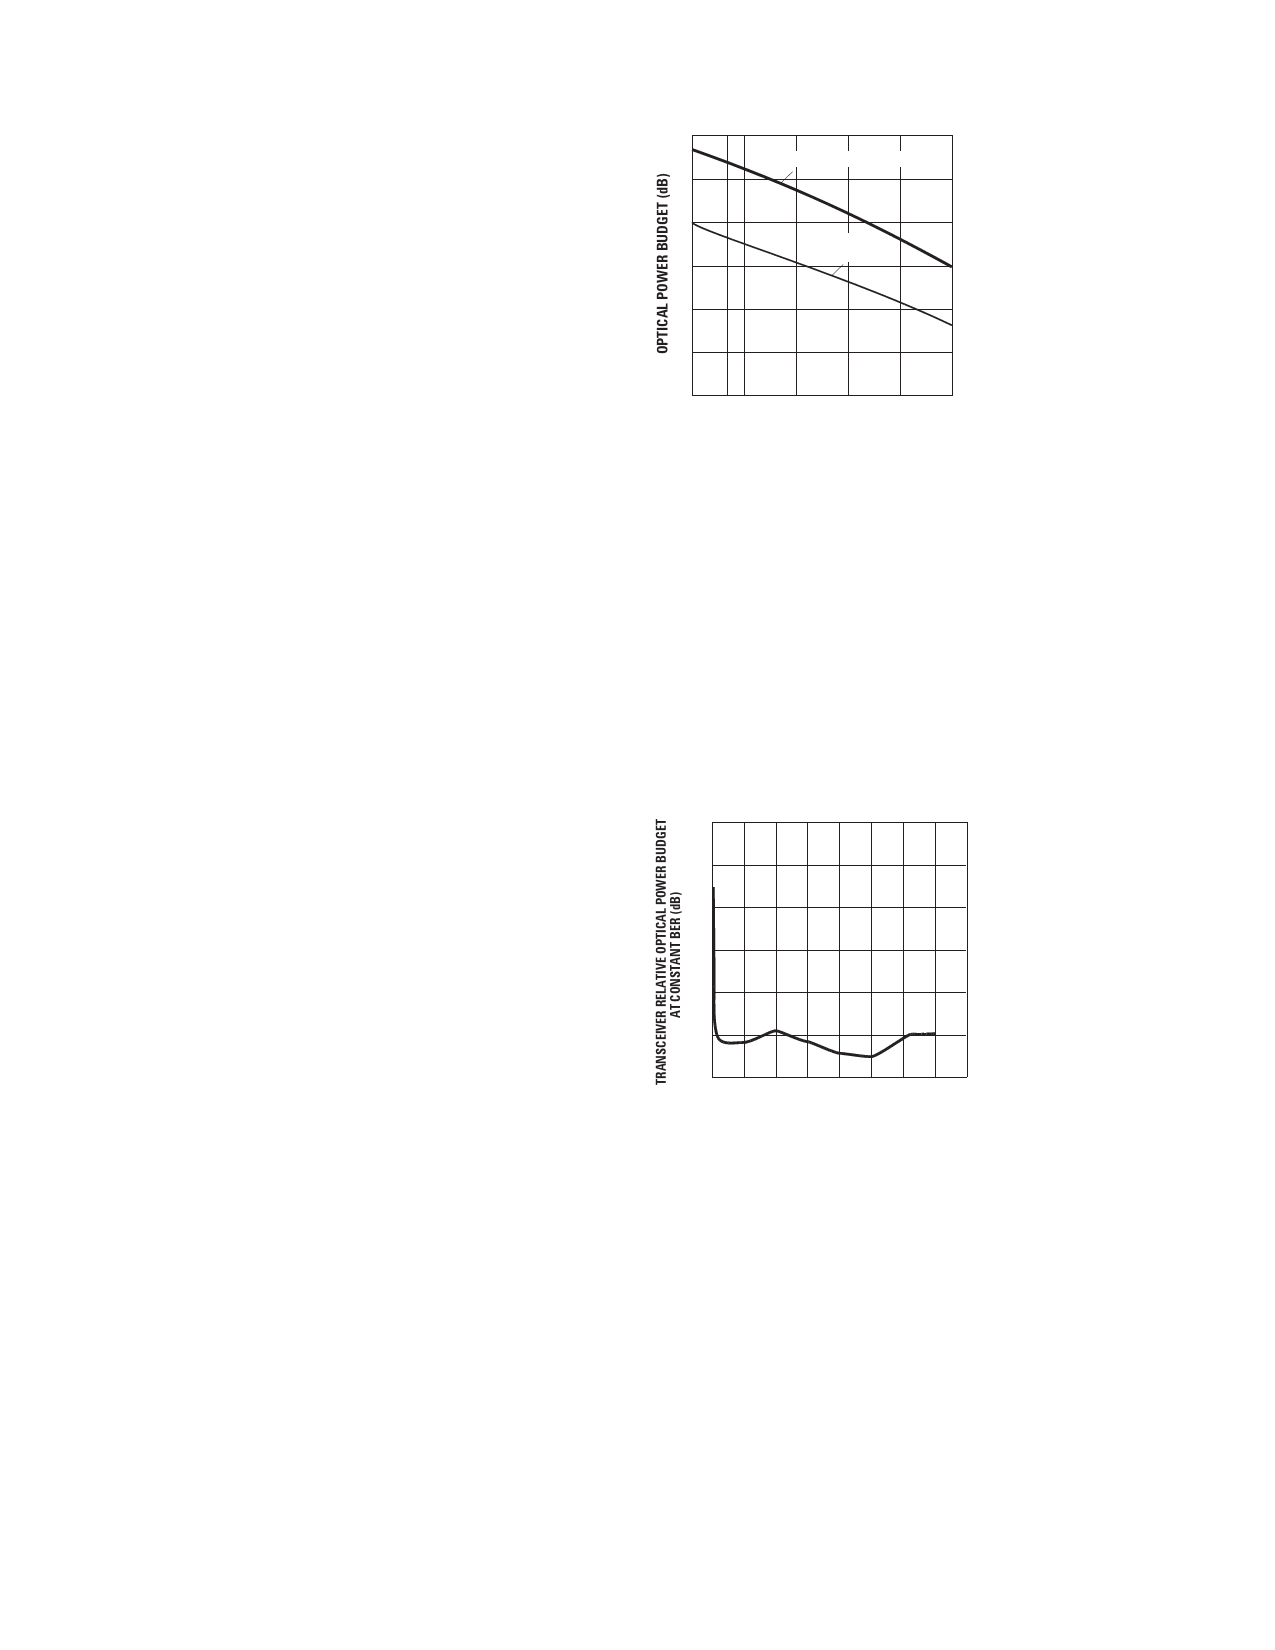
Transceiver Optical Power Budget versus Link Length
Optical Power Budget (OPB) is the available optical
power for a fiber optic link to accommodate fiber cable
losses plus losses due to in-line connectors, splices,
optical switches, and to provide margin for link aging
and unplanned losses due to cable plant reconfiguration
or repair.
Figure 4 illustrates the predicted OPB associated with
the transceiver series specified in this data sheet at the
Beginning of Life (BOL). These curves represent the at-
tenuation and chromatic plus modal dispersion losses
associated with the 62.5/125 µm and 50/125 µm fiber
cables only. The area under the curves represents the
remaining OPB at any link length, which is available for
overcoming non-fiber cable related losses.
Avago Technologies LED technology has produced
1300 nm LED devices with lower aging characteristics
than normally associated with these technologies in the
industry. The industry convention is 1.5 dB aging for 1300
nm LEDs. The Avago Technologies 1300 nm LEDs will
experience less than 1 dB of aging over normal commer
cial equipment mission life periods. Contact your Avago
Technologies sales representative for additional details.
Figure 4 was generated with a Avago Technologies fiber
optic link model containing the current industry conven-
tions for fiber cable specifications and the FDDI PMD
and LCF-PMD optical parameters. These parameters are
reflected in the guaranteed performance of the trans-
ceiver specifications in this data sheet. This same model
has been used extensively in the ANSI and IEEE commit-
tees, including the ANSI X3T9.5 committee, to establish
the optical performance requirements for various fiber
optic interface standards. The cable parameters used
come from the ISO/IEC JTC1/SC 25/WG3 Generic Cabling
for Customer Premises per DIS 11801 document and the
EIA/TIA-568-A Commercial Building Telecommunications
Cabling Standard per SP-2840.
12
AFBR-5803, 62.5/125 µm
10
8
AFBR-5803
50/125 µm
6
4
2
0 0.3 0.5
1.
0
1.5 2.0 2.5
FIBER OPTIC CABLE LENGTH (km)
Figure 4. Optical Power Budget at BOL versus Fiber Optic Cable Length.
Transceiver Signaling Operating Rate Range and BER Perfor-
mance
For purposes of definition, the symbol (Baud) rate, also
called signaling rate, is the reciprocal of the shortest
symbol time. Data rate (bits/sec) is the symbol rate
divided by the encoding factor used to encode the data
(symbols/bit).
When used in Fast Ethernet, FDDI and ATM 100 Mb/s
applications the performance of the 1300 nm transceiv-
ers is guaranteed over the signaling rate of 10 MBd to
125 MBd to the full conditions listed in individual product
specification tables.
2.5
CONDITIONS:
1. PRBS 27-1
2.0
2. DATA SAMPLED AT
CENTER OF DATA SYMBOL.
3. BER = 10-6
1.5
4. TA = +25˚ C
5. VCC = 3.3 V to 5 V dc
6. INPUT OPTICAL RISE/
1.0
FALL TIMES = 1.0/2.1 ns.
0.5
0
0.5
0 25 50 75 100 125 150 175 200
SIGNAL RATE (MBd)
Figure 5. Transceiver Relative Optical Power Budget at Constant BER vs.
Signaling Rate.
The transceivers may be used for other applications at
signaling rates outside of the 10 MBd to 125 MBd range
with some penalty in the link optical power budget
primarily caused by a reduction of receiver sensitivity.
Figure 5 gives an indication of the typical performance
of these 1300 nm products at different rates.
These transceivers can also be used for applications
which require different Bit Error Rate (BER) performance.
Figure 6 illustrates the typical trade-off between link BER
and the receivers input optical power level.
Share Link: