AMMC-6430 データシートの表示(PDF) - Avago Technologies
部品番号
コンポーネント説明
メーカー
AMMC-6430 Datasheet PDF : 7 Pages
| |||
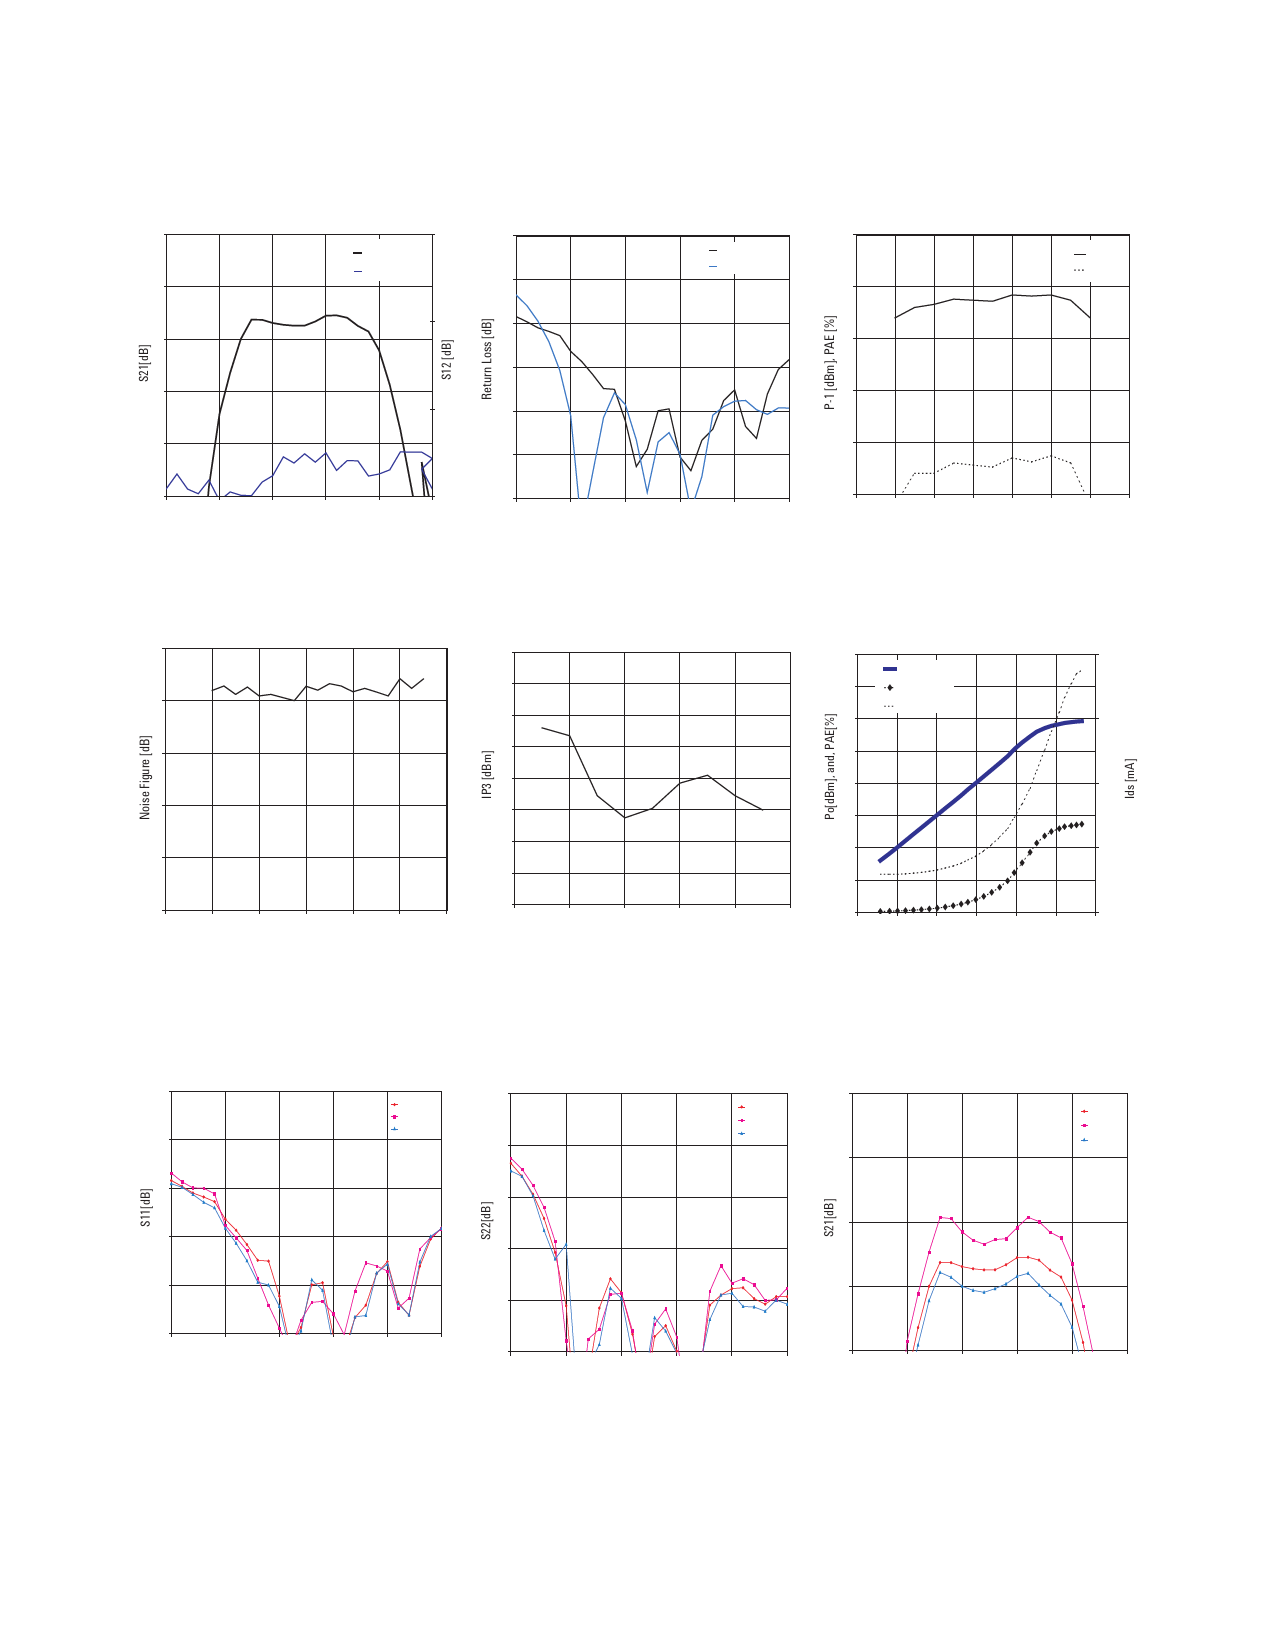
AMMC-6430 Typical Performances (TA = 25°C, Vd =5.5 V, ID = 900 mA, Zin = Zout = 50 Ω)
NOTE: These measurements are in a 50 Ω test environment. Aspects of the amplifier performance may be improved
over a more narrow bandwidth by application of additional conjugate, linearity, or power matching.
10
0
S1[dB]
S11[dB]
P-1
S1[dB]
S[dB]
PAE
0
-
0
-10
-10
1
-1
10
0
-0
-0
1
-
0
1
0
0
Frequency [GHz]
Figure 1. Typical Gain and Reverse
Isolation
-0
0
-0
1
0
0
0
Frequency [GHz]
10
8 0
Frequency [GHz]
Figure 2. Typical Return Loss (Input and
Output)
Figure 3. Typical Output Power (@P-1dB)
and PAE
10
8
0
8
0
Frequency [GHz]
0
8
0
8
0
Frequency [GHz]
Figure 4. Typical Noise Figure
Figure 5. Typical Output 3rd Order
Intercept Pt.
0
10
Pout(dBm)
PAE[%]
Id(total)
0
110
0
100
1
10
90
0
80
-10 -
0
10 1 0
Pin [dBm]
Figure 6. Typical Output Power, PAE, and
Total Drain Current versus Input Power
at30GHz
0
S11_0
S11_-0
S11_8
-
-10
-1
-0
-
1
0
0
0
Frequency[GHz]
Figure 7. Typical S11 over temperature
0
0
S_0
S_-0
S_8
-
S1_0
S1_-0
S1_8
-10
0
-1
1
-0
-
1
0
0
0
Frequency[GHz]
Figure 8. Typical S22 over temperature
10
1
0
0
0
Frequency[GHz]
Figure 9. Typical Gain over temperature
Share Link: 