STPS40M100C データシートの表示(PDF) - STMicroelectronics
部品番号
コンポーネント説明
メーカー
STPS40M100C Datasheet PDF : 12 Pages
| |||
STPS40M100C
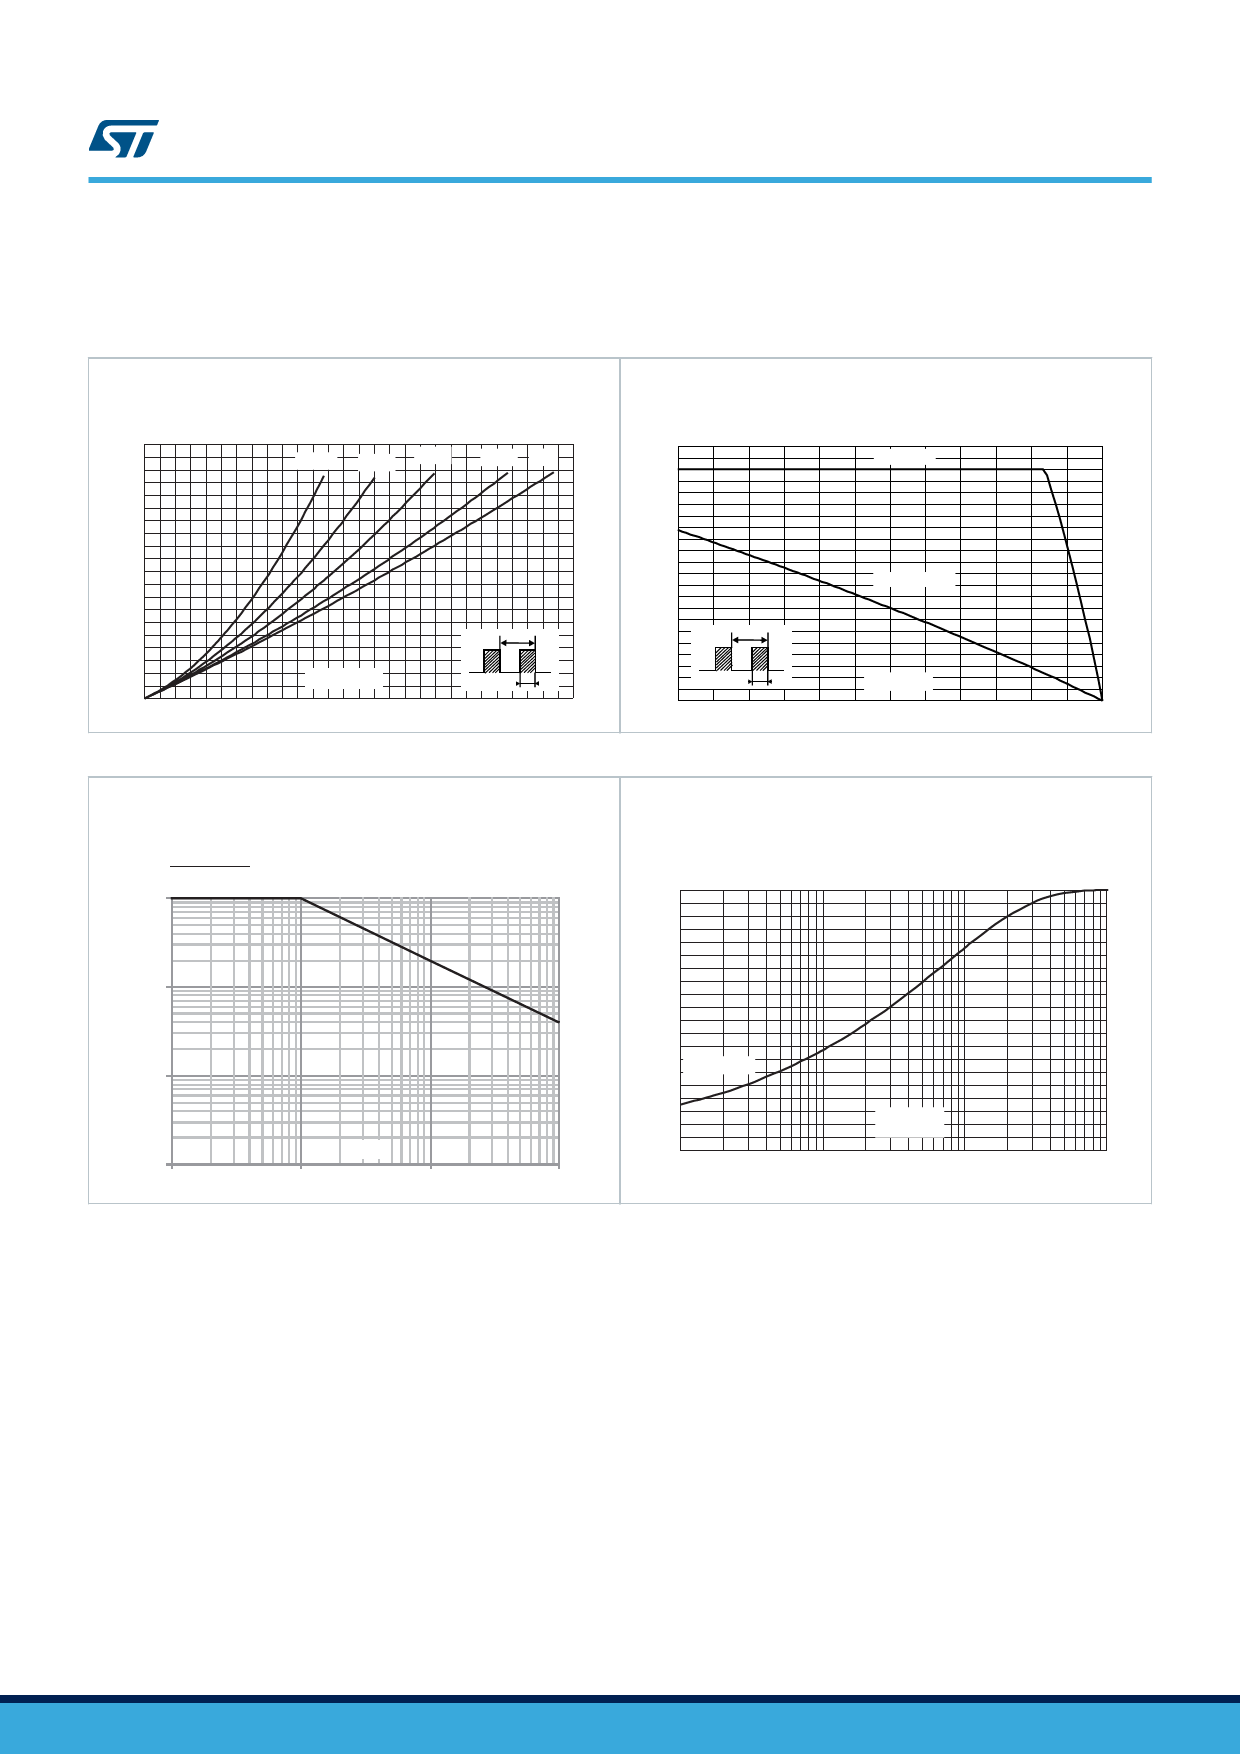
Characteristics (curves)
1.1
Characteristics (curves)
Figure 1. Average forward power dissipation versus
average forward current (per diode)
20 PF(AV)(W)
18
16
14
12
10
8
6
4
2
0
0 2 46
δ=0.05
δ=0.1
δ=0.2
δ=0.5 δ=1
T
IF(AV)( A)
δ=tp/T
tp
8 10 12 1 4 1 6 18 2 0 2 2 2 4 26 2 8
Figure 2. Average forward current versus ambient
temperature (δ = 0.5, per diode)
22 IF(AV)(A)
20
Rth(j-a)=Rth(j-c)
18
16
14
12
10
Rth(j-a)= 15 °C/W
8
6
T
4
2
δ=tp/T
tp
Tamb(°C)
0
0
25
50
75
100
125
150
Figure 3. Normalized avalanche power derating versus
pulse duration (Tj = 125 °C)
PARM (t p )
PARM(10 µs)
1
0.1
0.01
0.001
1
t p(µs)
10
100
1000
Figure 4. Relative variation of thermal impedance junction
to case versus pulse duration
Zth(j-c) /Rth(j-c)
1.0
0.9
0.8
0.7
0.6
0.5
0.4
0.3 Single pulse
0.2
0.1
0.0
1.E-03
1.E-02
tp(s )
1.E-01
1.E+00
DS6170 - Rev 4
page 4/12
Share Link: 