FSFR1800US データシートの表示(PDF) - Fairchild Semiconductor
部品番号
コンポーネント説明
メーカー
FSFR1800US Datasheet PDF : 15 Pages
| |||
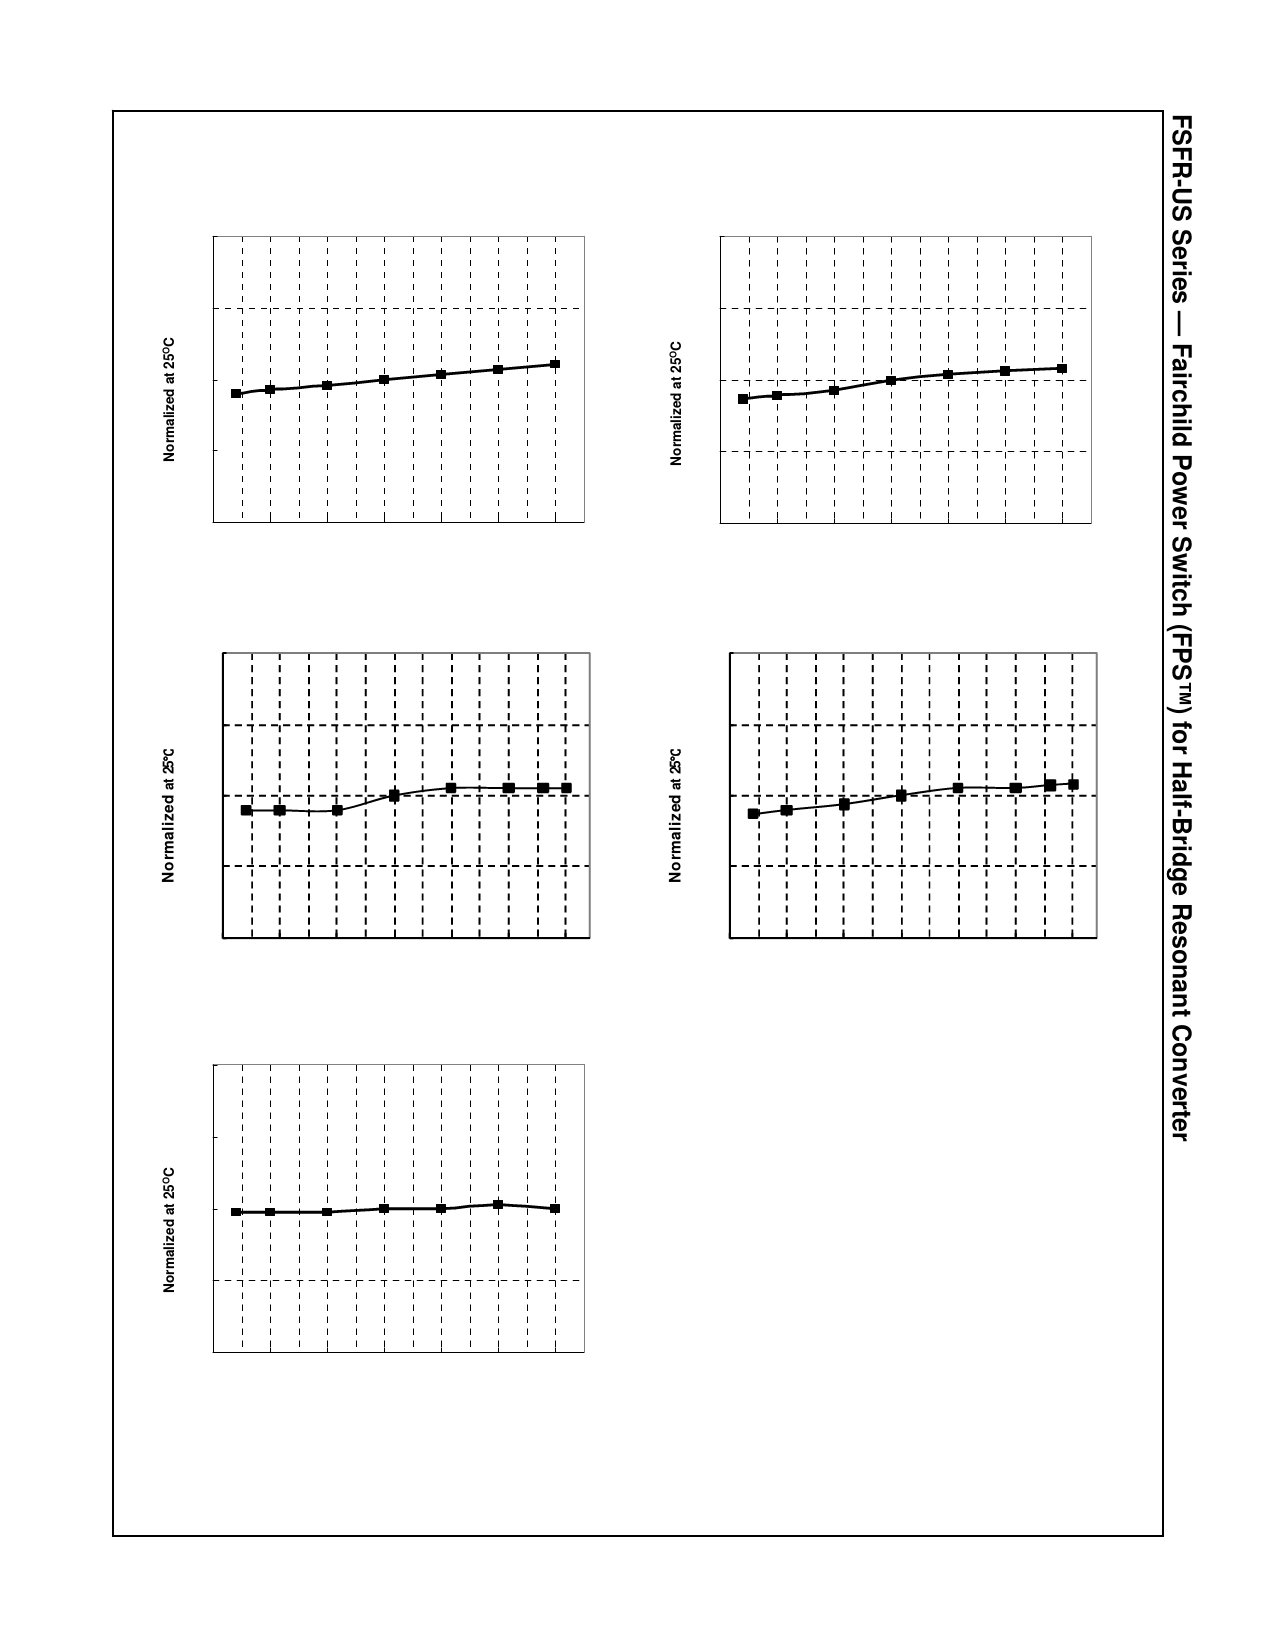
Typical Performance Characteristics (Continued)
These characteristic graphs are normalized at TA=25ºC.
1.1
1.1
1.05
1.05
1
1
0.95
0.95
0.9
-50
-25
0
25
50
Temp (OC)
75
100
Figure 10. LVCC OVP Voltage vs. Temperature
1.10
0.9
-50
-25
0
25
50
Temp (OC)
75
100
Figure 11. RT Voltage vs. Temperature
1.10
1.05
1.05
1.00
1.00
0.95
0.95
0.90
-50
-25
0
25
50
75
100
Temp( Ԩ )
Figure 12. VCssL vs. Temperature
1.1
0.90
-50
-25
0
25
50
75
100
Temp( Ԩ )
Figure 13. VCssH vs. Temperature
1.05
1
0.95
0.9
-50
-25
0
25
50
Temp (OC)
75
100
Figure 14. OCP Voltage vs. Temperature
© 2009 Fairchild Semiconductor Corporation
FSFR-US Series • Rev.1.0.2
9
www.fairchildsemi.com
Share Link: 