935267010117 データシートの表示(PDF) - Philips Electronics
部品番号
コンポーネント説明
メーカー
935267010117 Datasheet PDF : 17 Pages
| |||
Philips Semiconductors
Frame Transfer CCD Image Sensor
Objective specification
FXA 1012
Performance
The test conditions for the performance characteristics in the still
mode of operation are as follows:
• All values are measured using typical operating conditions.
• Integration time = 1/30 sec (unless specified otherwise).
• Test temperature = 60°C (333K).
• The light source is a 3200K lamp with a 1.7mm thick BG40 infrared
cut-off filter; F=16.
• Vertical Anti-Blooming condition
• Horizontal transport frequency = 25MHz.
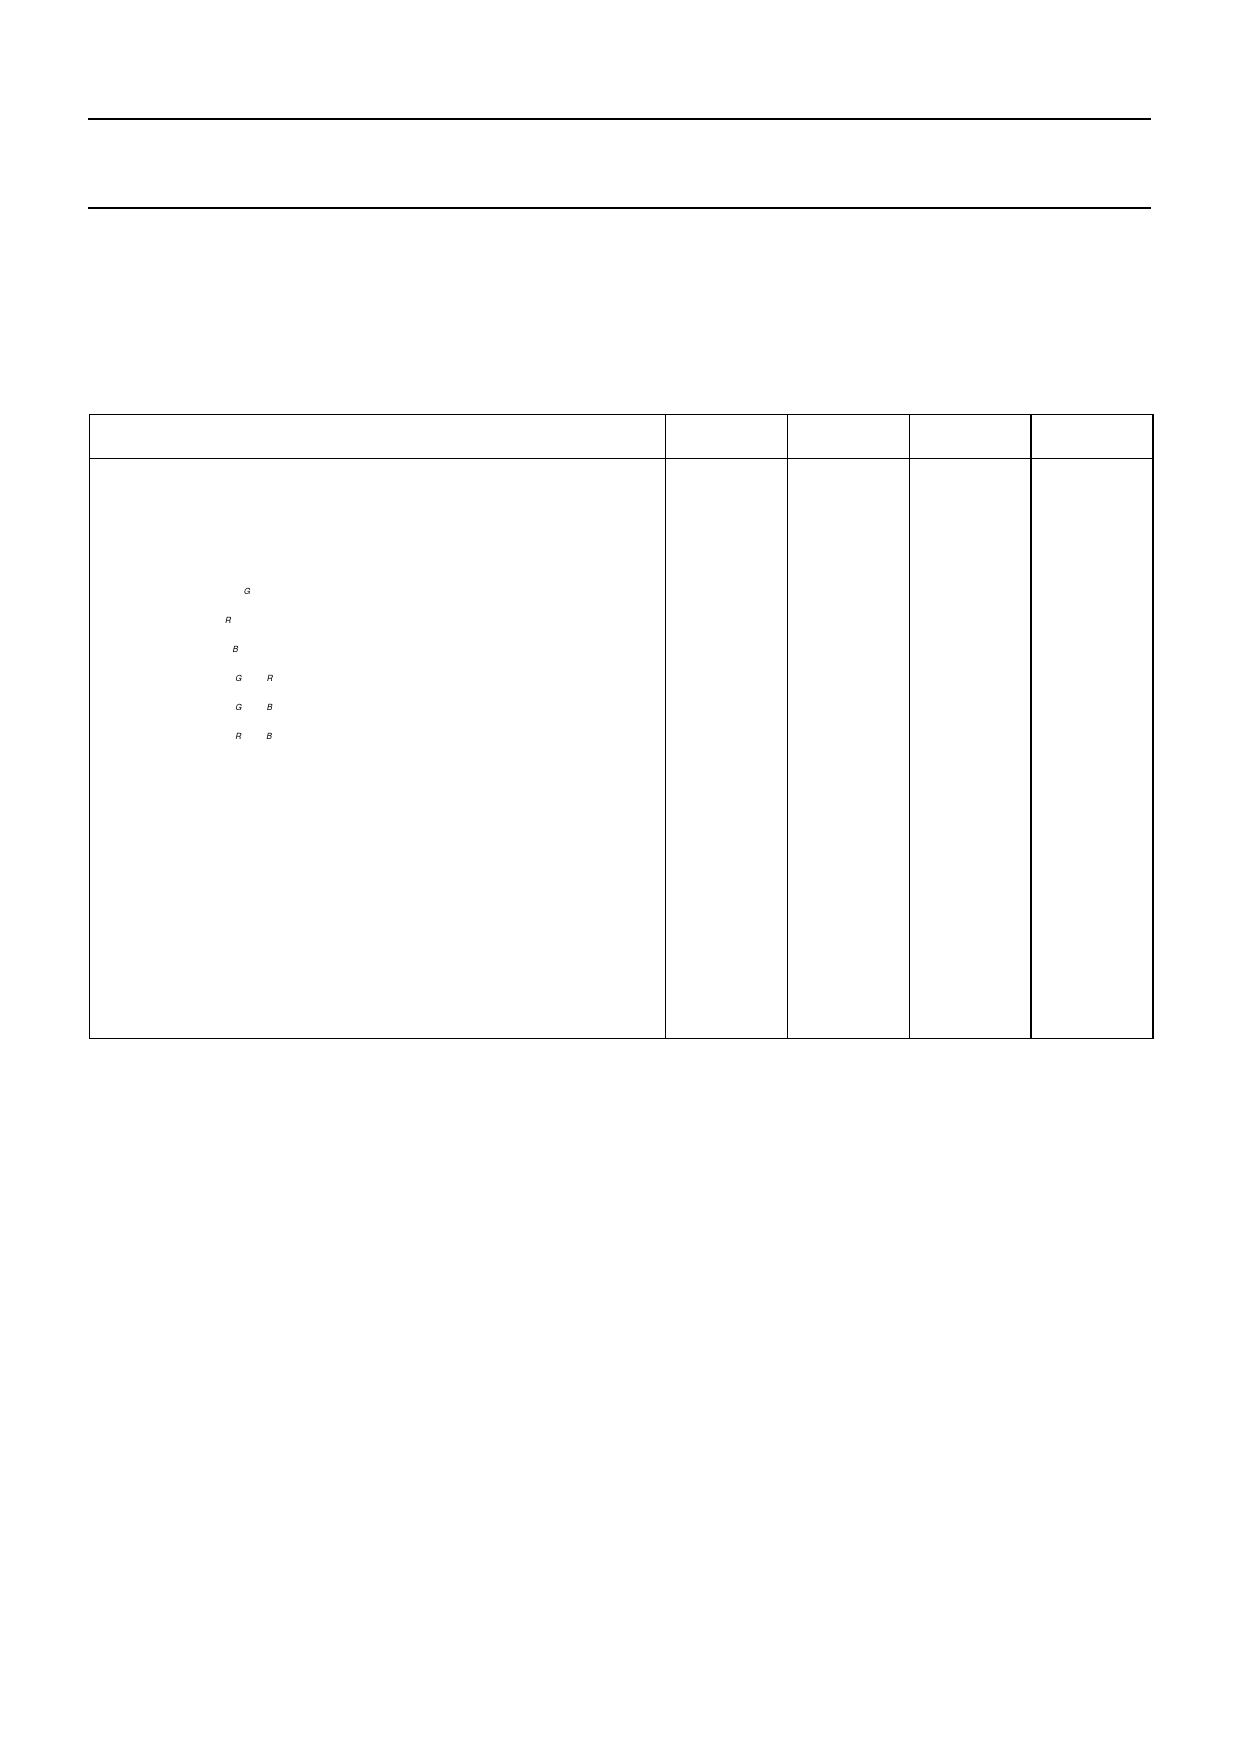
Performance Characteristics
Min.
Typical
Max.
Unit
Charge Transfer Efficiency 1 vertical
Charge Transfer Efficiency 1 horizontal
Image lag
Sensitivity, green SG 2
Sensitivity, red SR 2
Sensitivity, blue SB 2
Sensitivity Ratio SG / SR
Sensitivity Ratio SG / SB
Sensitivity Ratio SR / SB
Shading per colour plane 3
Differential colour shading 4
PRNU per colour plane
Green–green difference 5
Power consumption (Still mode)
Power consumption (Monitoring mode)
Full-well capacity saturation level (Qmax) 6
Saturation signal
Dynamic range at 20°C : 20log(Qmax /noise electrons)
Overexposure 7 handling
0.999997
0.999997
0
%
295
mV/lux.s
240
mV/lux.s
175
mV/lux.s
1.25
1.7
1.4
2
%
%
0.8
2.5
%
5
%
40
50
60
mW
mW
35
45
55
x 103
720
1000
1500
mV
72
dB
100
x Qmax level
1 Charge Transfer Efficiency values are expressed as the value per gate transfer.
2 The sensitivity when a light source directly illuminates the CCD.
3 Shading is defined as the one-σ value of the pixel output distribution expressed as a percentage of the mean value output (low-pass image).
4 Difference in shading between the four colour planes, with standard imaging condition, still mode.
5 Difference in average green signal between ‘green in red line’ and ‘green in blue line’, with standard imaging condition, still mode
6 Q max is determined from the lowpass filtered image.
7 Overexposure over entire area while maintaining good Vertical Anti-Blooming (VAB). It is tested by measuring the dark line.
2000 January
10
Share Link: 